


Review of Nagios Systems Monitoring Application
Nagios System Monitoring application is one of the most popular tools used by Sysadmins around the world. Sure it has its issues, or things it hasnt been upgraded to do (like better notifications especially in a smartphone age), but it has proved to be a reliable application none the less.
I have used Nagios for various companies I have worked for for over 10 years now, and the main thing I have always had in my mind when implementing it is to ‘USE IT FOR WHAT IT IS INTENDED’.
This article attempts to detail how a Sysadmin should use Nagios, the environments it is most suited for, and how you can maximise its benefits.
Background
My role as a Sysadmin over the years has been mainly as an Integrator of systems. Having started out in IT 25 years ago from a mainframe background, I have seen how business practices and technology advances have evolved to better meet business needs. As IT technology and infrastructure improved we started to see large companies and corporations migrate their core systems from hugely expensive mainframes in order to get the performance they needed for their applications, to much more modestly priced servers, and then on into modular structure, with multiple servers, performing specific tasks, that together provide the business with the functionality it needs to achieve its goals.
This proliferation of physical quantity of servers had some consequences. Some people would say the major downside could be that multiple servers mean more ways for business functionality to have a problem (2 servers, twice the chance of an issue compared to 1 server… 10 servers, ten times the chances… etc). But any company director would tell you that company priorities and direction are an ever evolving set of things. Whether it is gaining more customers, improving the services it currently provides, looking to expand into new markets, or improving the efficiency of its workforce to meet the corporate challenges that we face.
Long gone are the days of buying a $1million beast of a server that performs all of these tasks, where it works out much more cost effective to buy multiple servers with the hardware and software characteristics best tuned to perform specific elements of a company infrastructure. Whether it is to enable better communication internally or externally with email or other messaging services, administering the company payroll and HR system, giving your company its external facing front end website, providing your marketing team with the reporting tools and statistics it needs, to not only analyse, but improve the way it works or identify new directions and opportunities. Each of these tasks (and many more as well) are distinct roles in the whole business vision, that even in isolation, provide a valuable service for any company.
Have a problem with 1 server now means you do not lose ALL of those elements ive described above, therefore lessening the business impact of any hardware or software problem.
Lets get back to the main topic of this article, but I think it is very important to get things in perspective from a company point of view as opposed to an IT point of view. Your IT infrastructure is only their to help your business achieve its goals.
Linux System Monitoring
One thing that hasnt changed too much in the last 20+ years, is the function of your system administrators and operations IT team. Whether your team is based in your datacentre, or spread around different offices in your country or even globally, they need to have the tools to spot potential issues, and to be able to react appropriately in order to resolve them in a timely manner. This where the multitude of system monitoring tools like Nagios come into play.
Nagios is the most recognised and ‘matured’ product out there, it has 1000s of metrics for you to choose from to measure and alert on the key metrics within your infrastructure from memory usage, disk usage, snmp nodes, number of processes, server load etc etc etc.
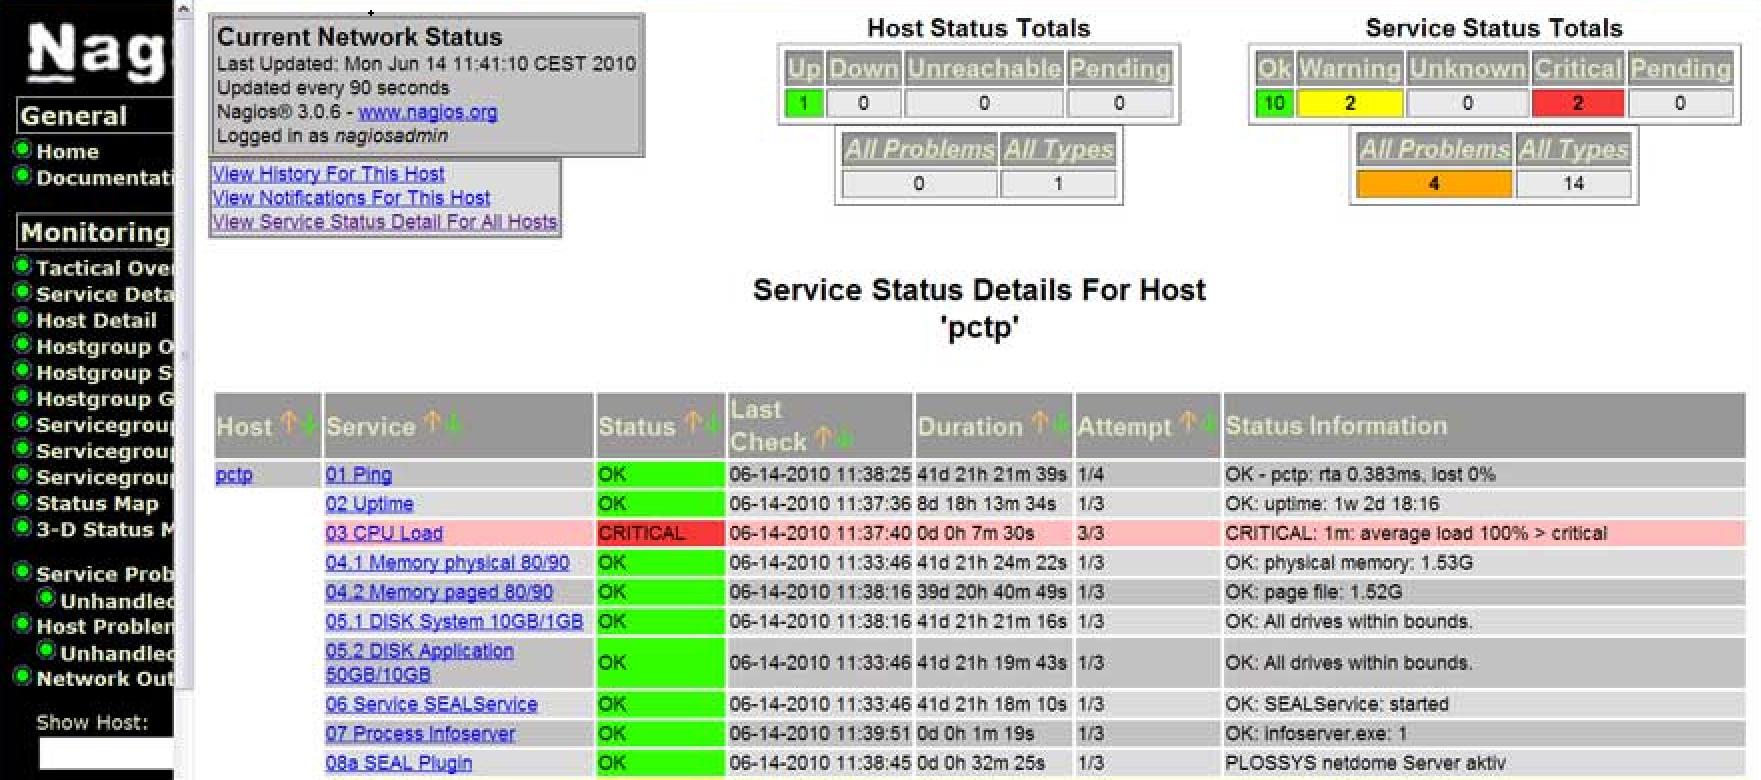
Nagios Host Monitoring – Nagios Systems Monitoring Review
Depending on the size of your server suite or organisation structure, Nagios allows you to group hosts or services into groups. I have worked for some large organisations, but can honestly say that I have never had the need or inclination to add that level of configuration and management of it in a live environment. An alert is an alert, and you want to know about it !
When I say ‘an alert is an alert and you want to know about it’, that is one of the main things for a system administrator to consider when implementing Nagios into their organisation. Nagios is an ALERTING tool, that means for every issue that you configure to alert you for, then there must be a solution that can be done in order to resolve it. This way of thinking is especially important in a multi-level support team. For example you have an operations team which is your 1st line support. Whether your work processes include 1st level support fixing issues or simply monitoring them, it is still important for them to have the detail of knowledge to know a) this is the problem, and b) this is how it will be fixed. Whether 1st line support actually performs the fix, or contacts someone else to do it, that knowledge builds a better understanding of an issues criticality, possibly what it impacts, and how it is resolved.
Every environment is different, and even different servers for different business purposes have different characteristics that help a system administrator to configure Nagios optimally. Getting an alert at 03.00 for a disk that has 10Gb space left available MAY be critical to an organisation which relies on large file uploads from a customer, however for a small internal mail server then its maybe not something that needs to wake you up.
Nagios has both a server side configuration (the nagios server), and a client side (the servers you are monitoring). Note that the Nagios server is ALSO important as a server to be monitored!! Problem on your Nagios server means potentially you are not monitoring all your other servers !
At the core of the Nagios server are your hosts and services definitions. These are 1) the hosts you are monitoring, 2) the services on each of those servers you need to check, and 3) how regularly you need to check each of those services. Once again these can be determined by a system administrator, BUT really they should be decided within your whole IT and Business Criticality team.
Problems mean downtime, downtime means loss of revenue, loss of revenue impacts company performance and goals.
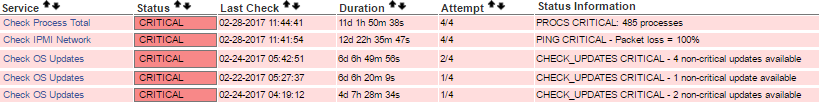
Examples of possibly Bad Metrics- Nagios Systems Monitoring Review
Using the above as an example, is 485 processes unusual? Can you do anything to fix it? Does it highlight a real issue? Does the fact that your IPMI connectivity to the server is not working? What is its business impact? Does someone immediately need to update some operating software just because there is a new release of something? Should you be so irresponsible to even think of doing that without testing it first, or at least knowing what the update addresses/fixes ??!!!
If you really need to know about your disk with 10Gb space left, and you need to know about it immediately, then you set that specific check to happen every 1minute. If you need that check to happen on 50 servers, then sure you can do that as well, but then you will start to see as you add more and more services to be monitored more and more frequently, that you are building load on your Nagios server, as well as your network, and possibly each client server as well.
There is always a compromise, checking 5000 services every minute may be perfectly ok in your environment, but what happens if 20 of those services all has a problem at the same time? Then you need to have the manpower resource in order to fix those issues. Just think very carefully when configuring your alerts to raise only the ones which have potential business impact.
Variations of Alert Notifications
I want to include a small section here for those who do not like email notifications, or to be looking at your monitor all the time to spot issues as they occur. There are a number of Android (and probably IOS as well) applications to bring Nagios to your smartphone. I have tried a few, but the one I have always relied on is called aNag. You can download aNag here –
https://play.google.com/store/apps/details?id=info.degois.damien.android.aNag&hl=en_GB
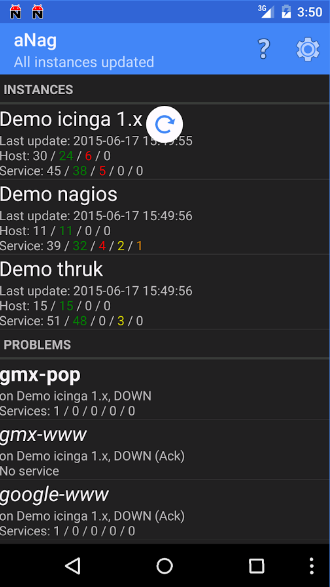
aNag Android Application – Monitoring from your smartphone – Nagios Systems Application Review
It has the functionality to alert, recheck and monitor all of your nagios instances and services. Maybe not the prettiest of apps, but lets be honest Nagios is not the prettiest of applications even in a web environment! But it does its job well if it is configured properly.
Summary for Best Practices using Nagios
I have waffled on enough (for now) about how I have used Nagios, and how it can be used optimally, so here is a quick summary –
1) Plan your Monitoring and Alerting.
What is important to you?
Why is it important?
Is there immediate remidial action that can be taken to resolve the issue?
How often does X need to be checked?
2) Think Business Impact.
If X fails, how does it affect my business?
Is issue X more critical than issue Y? Get your priorities right!
3) Monitoring something ‘because it can be monitored’ is not the way Nagios should be used.
Maybe there is a better tool to track your server load average?
Server Monitoring is not the same as Capacity Planning
4) Meeting SLA requirements
Once again Nagios CAN be, but also may not be, the best way to measure if you meet your SLA criteria.
5) Monitoring or Statistics
MONITORING !! There are 100 other tools to measure, graph, and project usage, issues, and other elements of your infrastructure
Download Nagios
You can download Nagios for free HERE